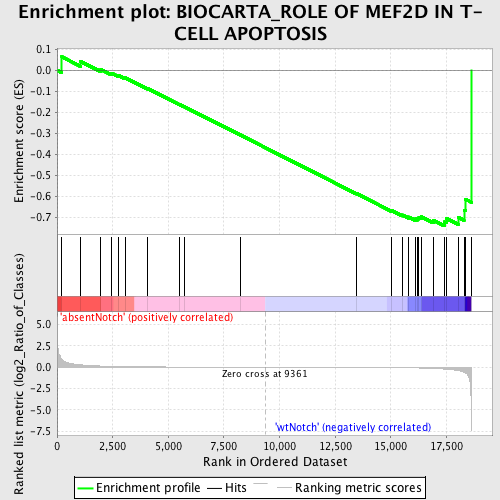
Profile of the Running ES Score & Positions of GeneSet Members on the Rank Ordered List
| Dataset | Set_03_absentNotch_versus_wtNotch.phenotype_absentNotch_versus_wtNotch.cls #absentNotch_versus_wtNotch.phenotype_absentNotch_versus_wtNotch.cls #absentNotch_versus_wtNotch_repos |
| Phenotype | phenotype_absentNotch_versus_wtNotch.cls#absentNotch_versus_wtNotch_repos |
| Upregulated in class | wtNotch |
| GeneSet | BIOCARTA_ROLE OF MEF2D IN T-CELL APOPTOSIS |
| Enrichment Score (ES) | -0.74198747 |
| Normalized Enrichment Score (NES) | -1.4692497 |
| Nominal p-value | 0.040169135 |
| FDR q-value | 0.5258162 |
| FWER p-Value | 1.0 |
| PROBE | DESCRIPTION (from dataset) | GENE SYMBOL | GENE_TITLE | RANK IN GENE LIST | RANK METRIC SCORE | RUNNING ES | CORE ENRICHMENT | |
|---|---|---|---|---|---|---|---|---|
| 1 | PPP3CB | 6020156 | 211 | 0.891 | 0.0646 | No | ||
| 2 | HDAC2 | 4050433 | 1050 | 0.273 | 0.0428 | No | ||
| 3 | HDAC1 | 2850670 | 1965 | 0.128 | 0.0046 | No | ||
| 4 | PTPRC | 130402 5290148 | 2453 | 0.091 | -0.0138 | No | ||
| 5 | CD247 | 3800725 5720136 | 2736 | 0.074 | -0.0227 | No | ||
| 6 | FYN | 2100468 4760520 4850687 | 3063 | 0.058 | -0.0353 | No | ||
| 7 | PLCG1 | 6020369 | 4062 | 0.030 | -0.0865 | No | ||
| 8 | MEF2D | 5690576 | 5515 | 0.014 | -0.1634 | No | ||
| 9 | CAPN2 | 430687 2360601 6980609 | 5712 | 0.013 | -0.1728 | No | ||
| 10 | NR4A1 | 6290161 | 8225 | 0.003 | -0.3077 | No | ||
| 11 | CABIN1 | 6900446 | 13468 | -0.017 | -0.5882 | No | ||
| 12 | PPP3CA | 4760332 6760092 | 15017 | -0.041 | -0.6680 | No | ||
| 13 | CAMK2B | 2760041 | 15509 | -0.057 | -0.6896 | No | ||
| 14 | LCK | 3360142 | 15797 | -0.069 | -0.6991 | No | ||
| 15 | PRKCA | 6400551 | 16106 | -0.085 | -0.7084 | No | ||
| 16 | NFATC1 | 510400 2320348 4050600 6180161 6290136 6620086 | 16205 | -0.091 | -0.7059 | No | ||
| 17 | CD4 | 1090010 | 16262 | -0.094 | -0.7009 | No | ||
| 18 | LAT | 3170025 | 16367 | -0.102 | -0.6978 | No | ||
| 19 | CD3E | 3800056 | 16914 | -0.148 | -0.7146 | No | ||
| 20 | CAPNS1 | 3940113 | 17424 | -0.225 | -0.7228 | Yes | ||
| 21 | ZAP70 | 1410494 2260504 | 17495 | -0.237 | -0.7064 | Yes | ||
| 22 | PPP3CC | 2450139 | 18031 | -0.395 | -0.7015 | Yes | ||
| 23 | CD3G | 2680288 | 18293 | -0.577 | -0.6664 | Yes | ||
| 24 | CD3D | 2810739 | 18351 | -0.648 | -0.6142 | Yes | ||
| 25 | TRB@ | 3940292 | 18616 | -7.377 | -0.0000 | Yes |

